Helm part2 on applying values
Ok so here’s part 2 continuation of my notes on Helm intro, continuing from the intro to Helm charts, repositories, and releases.
How do we know what values are available for a chart?
first of all, how do we know what are the values/configurations that we can set for a chart?
One - read values.yaml
well, the chart itself has a values.yaml file that contains the default values for the chart in its git repo, website.
Two - read README.yaml
We could check the chart’s documentation or the README.md file? Should we trust that the documentation is up to date?
Three - generate a sample values.yaml file
The best way to know what values are available is to generate a sample values.yaml file from the chart itself.
We can do this with the helm show values command, which will output the default values for the chart in YAML format.
In my home cluster, I have a prometheus-stack chart installed, and I want to see what values are available for it.
Write it out to a file called default-value.yaml. We’ll refer to this file when we want to customize the chart’s configuration for our own needs.
# let's use proemetheus-stack as an example.
helm show values prometheus-community/kube-prometheus-stack> default-value.yaml
So say I want to add ingress for my grafana dashboard, I can check the default-value.yaml file for the ingress section and see what values are available to set.
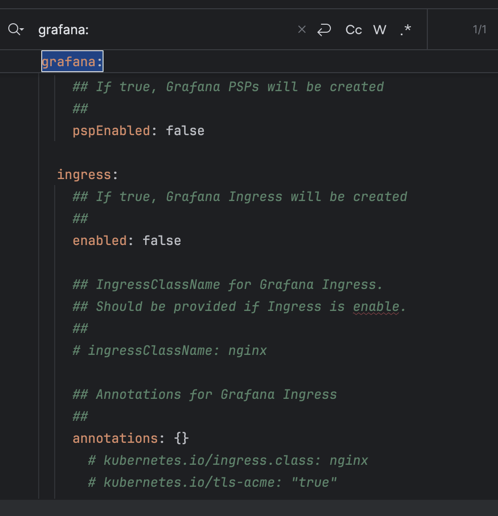
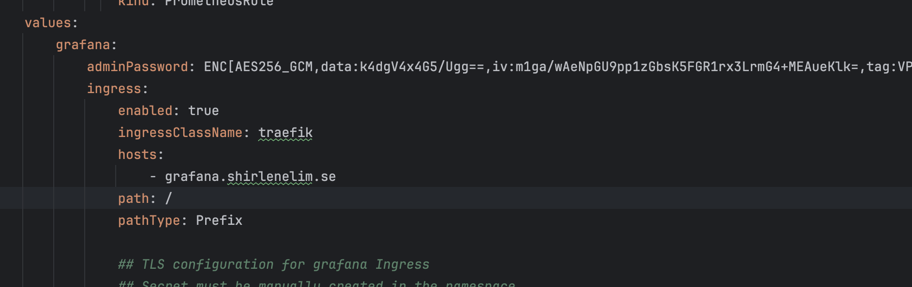
so just copy the lines, that applies to ingress, and paste it into a new file called release.yaml, then modify the values as needed.
Applying the values
So now we have release.yaml with our customizations. Since I’m using Flux, I don’t run
helm upgrade directly — instead, the HelmRelease custom resource points to this file
via valuesFrom, and Flux’s helm-controller reconciles it against the cluster.
Something like this in the HelmRelease:
apiVersion: helm.toolkit.fluxcd.io/v2
kind: HelmRelease
metadata:
  name: kube-prometheus-stack
  namespace: monitoring
spec:
  chart:
    spec:
      chart: kube-prometheus-stack
      sourceRef:
        kind: HelmRepository
        name: prometheus-community
  valuesFrom:
    - kind: ConfigMap
      name: kube-prometheus-stack-values
      valuesKey: release.yaml
release.yaml itself gets committed to git (mine’s here),
usually wrapped in a ConfigMap or Secret depending on whether it holds sensitive values.
Flux picks up the change, diffs it against the live HelmRelease, and reconciles — no manual
helm upgrade needed.
If you want to sanity check what Flux is about to apply before it lands, you can still run:
helm show values prometheus-community/kube-prometheus-stack -f release.yaml
on your local values file to see the merged result, same as before.
For the ingress on Grafana specifically, the values I ended up needing beyond the host and
path were the ingressClassName and the cert-manager annotation, so cert-manager knows to
issue a TLS cert automatically. Without the annotation, ingress comes up fine but stays on
plain HTTP.
Gotchas
A couple of things that tripped me up:
- Helm doesn’t deep-merge lists. If the chart’s default
values.yamlhas an array (likeingress.hostsoringress.tls), whatever you put in your own values file replaces that array entirely rather than merging with it. So if you only override one field of a list item, you need to copy the whole item, not just the field you’re changing. helm show values -foutput isn’t a 1:1 preview of what gets applied. It’s the merged values, which is useful, but it won’t catch schema validation errors the chart might raise at install/upgrade time. Worth doing ahelm templateor a dry-run reconcile if you want to catch those before Flux applies anything.
After flux kustomization applied, we can see the grafana dashboard is now accessible via ingress with the new password set in the release.yaml file.
http://grafana.shirlenelim.se
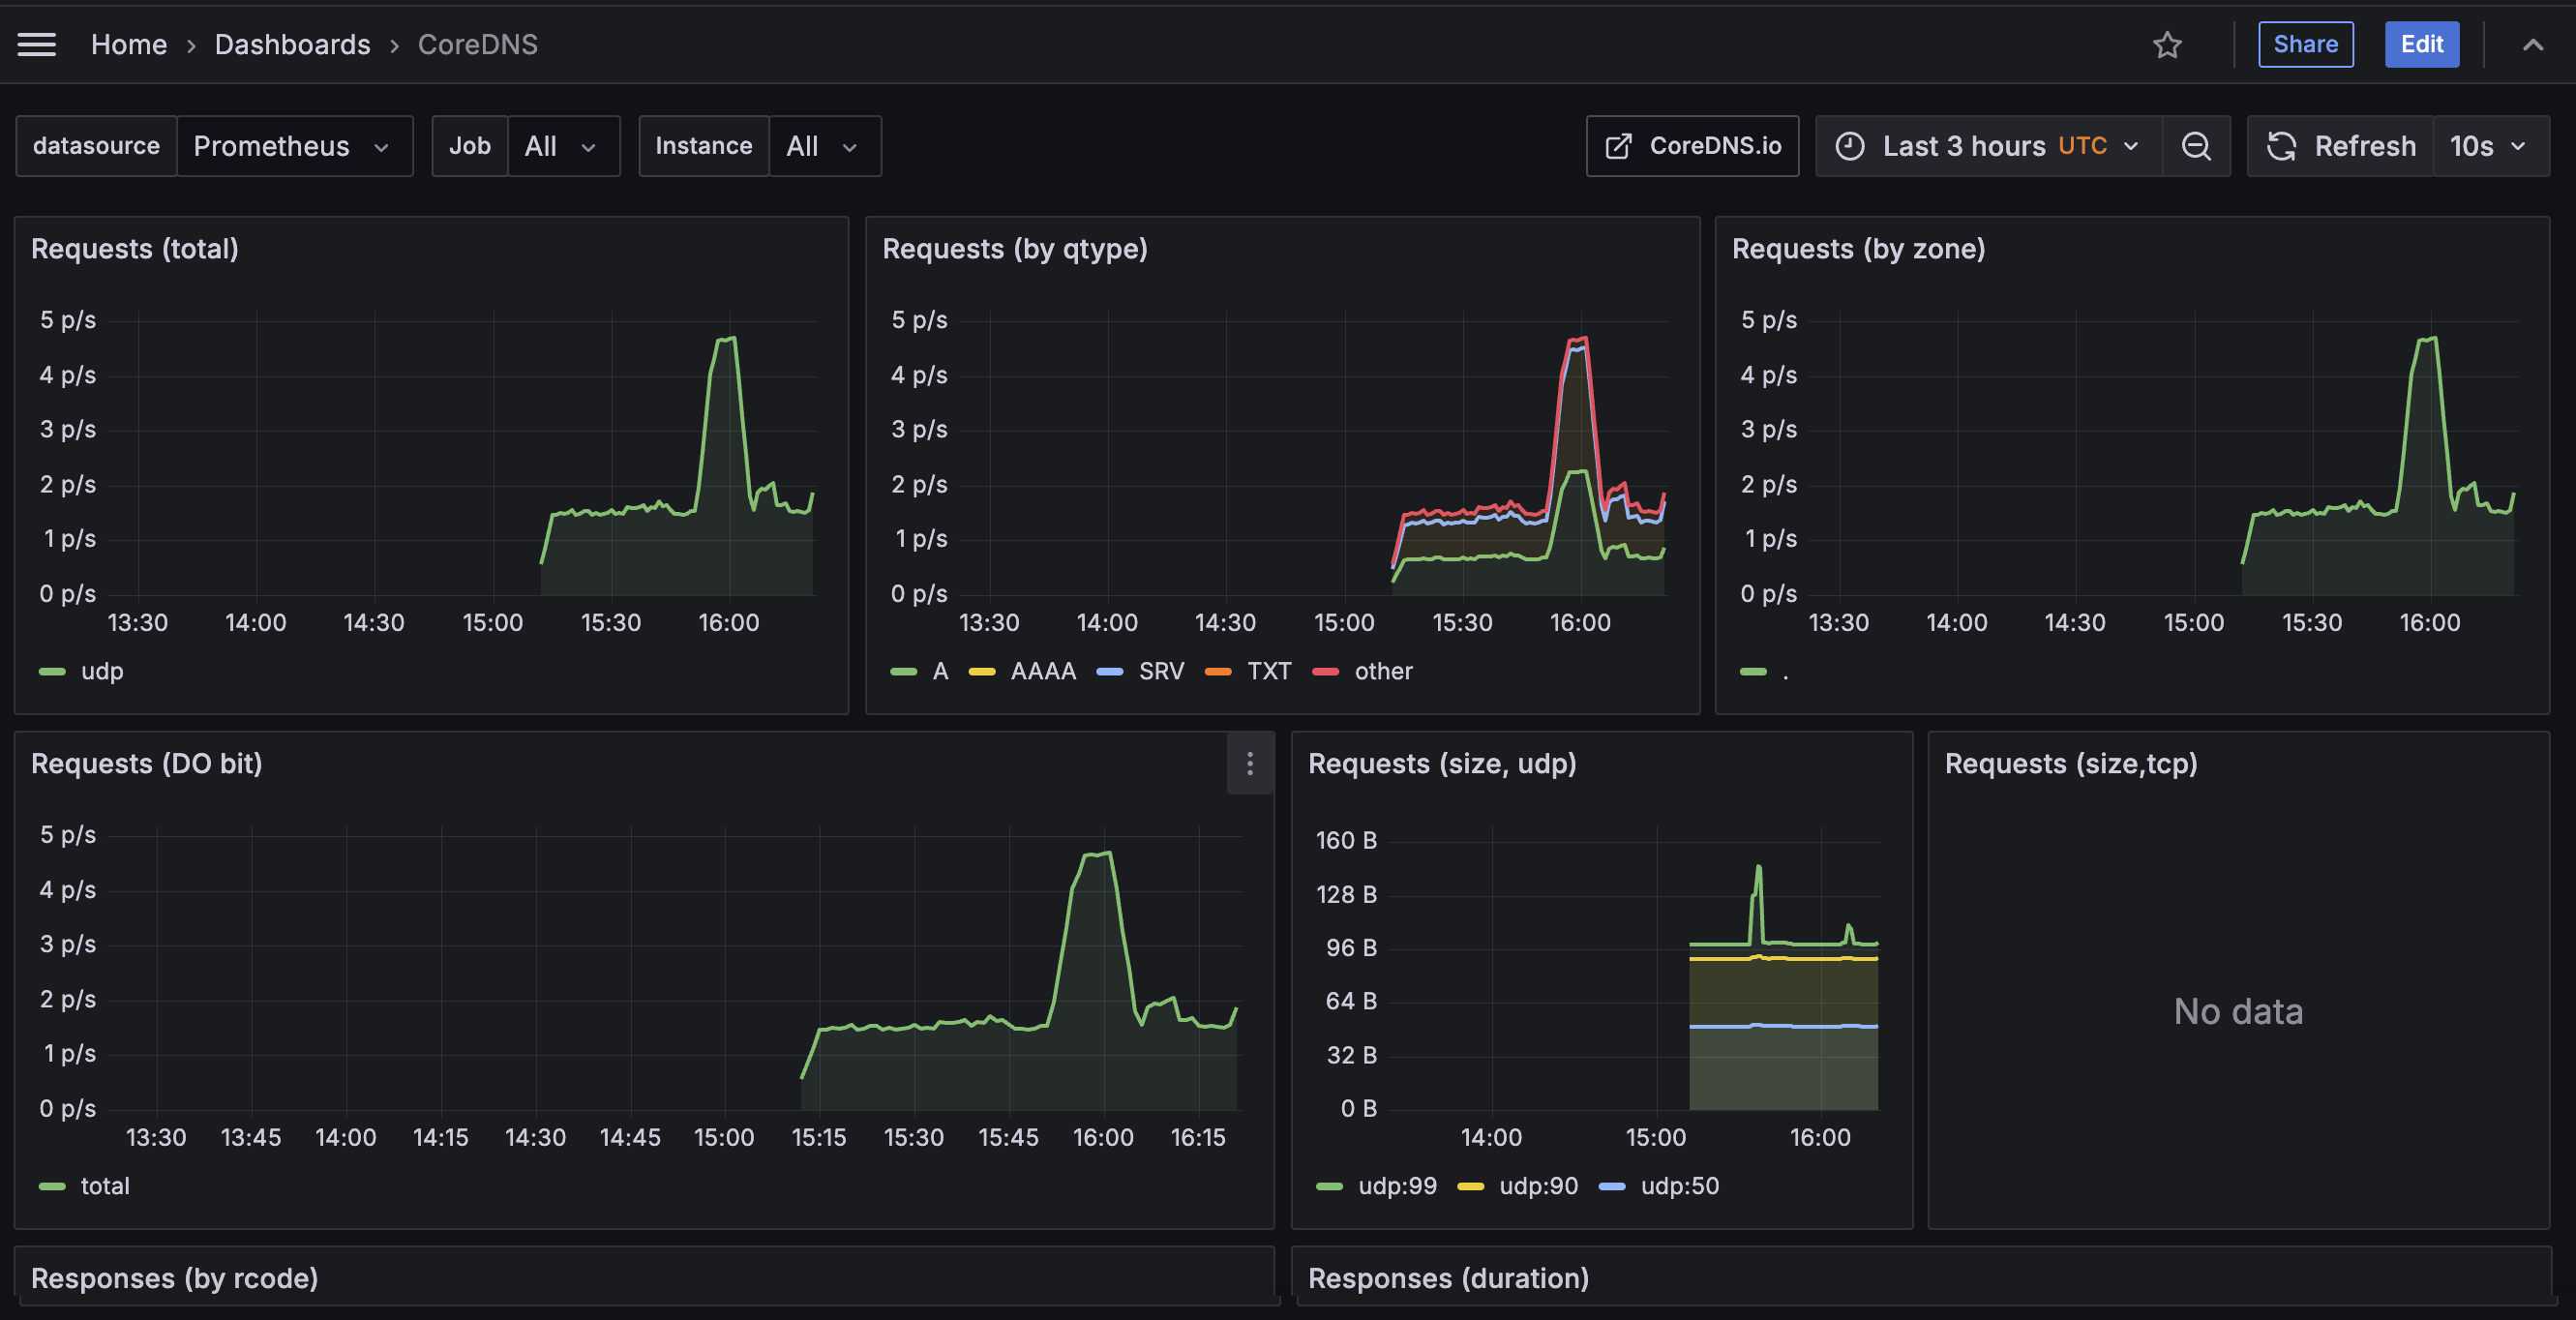
Here’s the CoreDNS dashboard